如图所示,
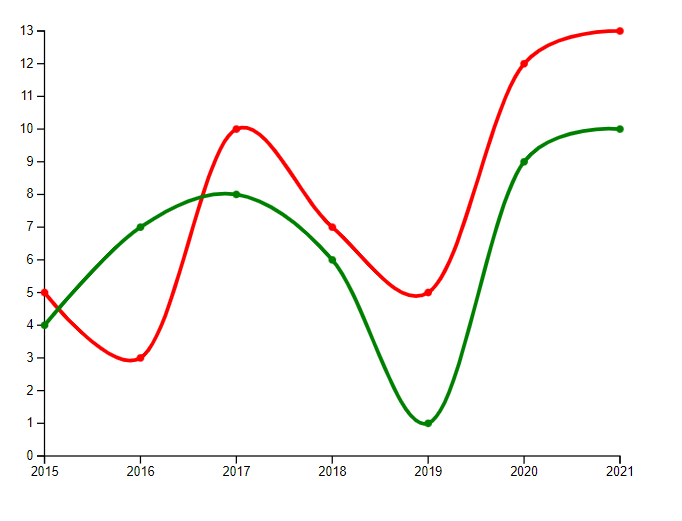
我在一张图表中有 2 个图。我想填充红色和绿色路径之间的空间。我试过使用,d3.area()但我不知道如何正确使用它。
这是代码:
d3.csv("test.csv")

    .then(data => {
        console.log("Datos cargados correctamente");
        valor_Esp = [];
        valor_Ptg = [];

        color = {"Espa?a": "red", "Portugal": "green"};
        data.forEach( d => {
            if (d.Pais == 'Espa?a'){
                valor_Esp.push([d.A?o, d.Valor]);}
            else if (d.Pais == 'Portugal'){
                valor_Ptg.push([d.A?o, d.Valor])
            }
        })

        together = {"Espa?a": valor_Esp, "Portugal": valor_Ptg}
        console.log(valor_Ptg)
        margin = ({top: 40, right: 20, bottom: 40, left: 50});
        height = 500 - margin.top - margin.bottom;
        width = 600 - margin.left - margin.right;


        var svg = d3.select("body")
            .append("svg")
            .attr("width", width)
            .attr("height", height);


        x = d3.scaleTime()
            .domain([d3.min(data, d => d.A?o),
                d3.max(data, d => d.A?o)]).nice()
            .range([margin.left, width - margin.right]);

        y = d3.scaleLinear()
            .domain([0,
                d3.max(data, d =>  d.Valor)]).nice()
            .range([height - margin.bottom, margin.top]);


        svg.append("g")
            .attr("transform", `translate(0, ${height - margin.bottom})`)
            .call(d3.axisBottom(x).tickFormat(d3.format("d")));
        svg.append("g")
            .attr("transform", `translate(${margin.left}, 0)`)
            .call(d3.axisLeft(y));

let curve = d3.curveCatmullRom.alpha(0.2)
                 let area = d3.area()
                 .x(function (d) { return x(d[0]) })
                 .y0(function (d) { return y(d[0]) })
                 .y1(function (d) { return y(d[0]) })
                 .curve(curve);

        var line_esp = d3.line()
                .x(function(d){
                    return x(d[0]);
                })
                .y(function(d){
                    return y(d[1]);
                })
                .curve(curve);


        var line_ptg = d3.line()
                .x(function(d){
                    return x(d[0]);
                })
                .y(function(d){
                    return y(d[1]);
                })
                .curve(curve);


        var path_esp = svg.append("path")
            .attr("d", line_esp(valor_Esp))
            .attr("stroke", "steelblue")
            .attr("stroke-width", "3")
            .attr("fill", "none")
            .style("stroke", color['Espa?a'])

            .on("click", function(){
                alert("Hola");
            })
            .on("mouseover", function(d){
                d3.select(this)
                .style("stroke", "gold")
                .attr("stroke-width", 6)
            })
            .on("mouseout", function(){
                d3.select(this)
                .style('stroke', color['Espa?a'])
                .attr("stroke-width", 3);
            });

        var path_ptg = svg.append("path")
            .attr("d", line_ptg(valor_Ptg))
            .attr("stroke", "steelblue")
            .attr("stroke-width", "3")
            .attr("fill", "none")
            .style("stroke", color['Portugal'])
            .on("click", function(){
                alert("Hola");
            })
            .on("mouseover", function(d){
                d3.select(this)
                .style("stroke", "gold")
                .attr("stroke-width", 6)
            })
            .on("mouseout", function(){
                d3.select(this)
                .style('stroke', color['Portugal'])
                .attr("stroke-width", 3);
            });


        svg.selectAll("circle_esp")
            .data(valor_Esp)
            .enter()
            .append("circle")
            .attr("cx", d => x(d[0]))
            .attr("cy", d => y(d[1]))
            .attr("r", 3)
            .style('fill', color['Espa?a'])
            .on("mouseover", function(d){
                d3.select(this)
                .style("fill", "gold")
                .attr("r", 6)
            })
            .on("mouseout", function(){
                d3.select(this)
                .style('fill', color['Espa?a'])
                .attr("r", 3);
            });


        svg.selectAll("circle_pt")
            .data(valor_Ptg)
            .enter()
            .append("circle")
            .attr("cx", d => x(d[0]))
            .attr("cy", d => y(d[1]))
            .attr("r", 3)
            .style('fill', color['Portugal'])
            .on("mouseover", function(d){
                d3.select(this)
                .style("fill", "gold")
                .attr("r", 6)
            })
            .on("mouseout", function(){
                d3.select(this)
                .style('fill', color['Portugal'])
                .attr("r", 3);
            });


    })

    .catch();
这就是.csv资料的样子:
A?o,Pais,Valor
2015,Espa?a,5
2015,Portugal,4
2016,Portugal,7
2016,Espa?a,3
2017,Portugal,8
2017,Espa?a,10
2018,Portugal,6
2018,Espa?a,7
2019,Portugal,1
2019,Espa?a,5
2020,Portugal,9
2020,Espa?a,12
2021,Portugal,10
2021,Espa?a,13
uj5u.com热心网友回复:
创建一个有填充但没有描边的组合路径:
const esp = valor_Esp.reverse();
const fullPath = `${line_ptg(valor_Ptg)} V ${y(esp[0][1])} ${line_ptg(esp)} V ${y(valor_Ptg[0][1])}`;

svg.append("path")
  .attr('d', fullPath)
  .style('stroke', 'none')
  .style('fill', 'blue')
  .style('fill-opacity', 0.25);
const csv = `A?o,Pais,Valor
2015,Espa?a,5
2015,Portugal,4
2016,Portugal,7
2016,Espa?a,3
2017,Portugal,8
2017,Espa?a,10
2018,Portugal,6
2018,Espa?a,7
2019,Portugal,1
2019,Espa?a,5
2020,Portugal,9
2020,Espa?a,12
2021,Portugal,10
2021,Espa?a,13`;

const data = d3.csvParse(csv);

valor_Esp = [];
valor_Ptg = [];

color = {"Espa?a": "red", "Portugal": "green"};
        data.forEach( d => {
            if (d.Pais == 'Espa?a'){
                valor_Esp.push([d.A?o, d.Valor]);}
            else if (d.Pais == 'Portugal'){
                valor_Ptg.push([d.A?o, d.Valor])
            }
        })

        together = {"Espa?a": valor_Esp, "Portugal": valor_Ptg}
        console.log(valor_Ptg)
        margin = ({top: 40, right: 20, bottom: 40, left: 50});
        height = 500 - margin.top - margin.bottom;
        width = 600 - margin.left - margin.right;


        var svg = d3.select("body")
            .append("svg")
            .attr("width", width)
            .attr("height", height);


        x = d3.scaleTime()
            .domain([d3.min(data, d => d.A?o),
                d3.max(data, d => d.A?o)]).nice()
            .range([margin.left, width - margin.right]);

        y = d3.scaleLinear()
            .domain([0,
                d3.max(data, d =>  d.Valor)]).nice()
            .range([height - margin.bottom, margin.top]);


        svg.append("g")
            .attr("transform", `translate(0, ${height - margin.bottom})`)
            .call(d3.axisBottom(x).tickFormat(d3.format("d")));
        svg.append("g")
            .attr("transform", `translate(${margin.left}, 0)`)
            .call(d3.axisLeft(y));

let curve = d3.curveCatmullRom.alpha(0.2)
                 let area = d3.area()
                 .x(function (d) { return x(d[0]) })
                 .y0(function (d) { return y(d[0]) })
                 .y1(function (d) { return y(d[0]) })
                 .curve(curve);

        var line_esp = d3.line()
                .x(function(d){
                    return x(d[0]);
                })
                .y(function(d){
                    return y(d[1]);
                })
                .curve(curve);


        var line_ptg = d3.line()
                .x(function(d){
                    return x(d[0]);
                })
                .y(function(d){
                    return y(d[1]);
                })
                .curve(curve);


        var path_esp = svg.append("path")
            .attr("d", line_esp(valor_Esp))
            .attr("stroke", "steelblue")
            .attr("stroke-width", "3")
            .attr("fill", "none")
            .style("stroke", color['Espa?a'])

            .on("click", function(){
                alert("Hola");
            })
            .on("mouseover", function(d){
                d3.select(this)
                .style("stroke", "gold")
                .attr("stroke-width", 6)
            })
            .on("mouseout", function(){
                d3.select(this)
                .style('stroke', color['Espa?a'])
                .attr("stroke-width", 3);
            });

        var path_ptg = svg.append("path")
            .attr("d", line_ptg(valor_Ptg))
            .attr("stroke", "steelblue")
            .attr("stroke-width", "3")
            .attr("fill", "none")
            .style("stroke", color['Portugal'])
            .on("click", function(){
                alert("Hola");
            })
            .on("mouseover", function(d){
                d3.select(this)
                .style("stroke", "gold")
                .attr("stroke-width", 6)
            })
            .on("mouseout", function(){
                d3.select(this)
                .style('stroke', color['Portugal'])
                .attr("stroke-width", 3);
            });

        svg.selectAll("circle_esp")
            .data(valor_Esp)
            .enter()
            .append("circle")
            .attr("cx", d => x(d[0]))
            .attr("cy", d => y(d[1]))
            .attr("r", 3)
            .style('fill', color['Espa?a'])
            .on("mouseover", function(d){
                d3.select(this)
                .style("fill", "gold")
                .attr("r", 6)
            })
            .on("mouseout", function(){
                d3.select(this)
                .style('fill', color['Espa?a'])
                .attr("r", 3);
            });


        svg.selectAll("circle_pt")
            .data(valor_Ptg)
            .enter()
            .append("circle")
            .attr("cx", d => x(d[0]))
            .attr("cy", d => y(d[1]))
            .attr("r", 3)
            .style('fill', color['Portugal'])
            .on("mouseover", function(d){
                d3.select(this)
                .style("fill", "gold")
                .attr("r", 6)
            })
            .on("mouseout", function(){
                d3.select(this)
                .style('fill', color['Portugal'])
                .attr("r", 3);
            });

const esp = valor_Esp.reverse();
const fullPath = `${line_ptg(valor_Ptg)} V ${y(esp[0][1])} ${line_ptg(esp)} V ${y(valor_Ptg[0][1])}`;

svg.append("path")
    .attr('d', fullPath)
  .style('stroke', 'none')
  .style('fill', 'blue')
.style('fill-opacity', 0.25)<script src="https://cdnjs.cloudflare.com/ajax/libs/d3/5.7.0/d3.min.js"></script>


0 评论