我正在尝试对.count()“pos”和“neg”这个词出现的次数做一个简单的操作,以便我可以将它应用到 Seaborn 上的条形图的 Y 轴上。
这是我的代码:
df['score'] = df['compound'].apply(lambda x: 'pos' if x>= 0 else 'neg')
df['overall'] = df[(df.score == "pos") & (df.score == "neg")].count()

plt.figure(2)
chart_2 = sns.barplot(x='Category', y='overall', data=df)
当我运行它时, plt.figure(2) 回传一个空图表。我试过.sum()哪个不起作用并且还回传一个空图表。
如果我执行此操作,它将回传总体总数,而不会Category在 x-ais 中对其进行分解。例如,所有类别总共有 58 个,这是资料框的总数。
df['overall'] = df['score'].count()
.value_counts()还回传一个空图表。
对于为什么会出现这种情况,我已经没有想法了!
提前致谢。
uj5u.com热心网友回复:
如评论中所述,(df.score == "pos") & (df.score == "neg")通过AND关系组合并False在所有情况下都会给出。在所有情况下,使用ORas in(df.score == "pos") | (df.score == "neg")都会给出 True。但是,它不会区分类别,所以df['overall']到处都是 58。
创建计数条形图的最简单方法是 seaborn 的sns.countplot(). 您可以设定x='Category'对每个类别进行计数。hue='score'将通过分数分裂。
要直接创建条形图并通过 pandas 进行计数,您需要类似df['overall'] = df['Category'].apply(lambda cat: (df['Category'] == cat).sum()). 在这里,创建一个布林值和值(df['Category'] == cat)阵列。当被呼叫到这些时,被认为是,所以将计算值的数量。TrueFalsesum()True1False0sum()True
Pandas 首选的按类别计数的方法是通过groupby('Category'),然后从size()每个组中获取。
这是一个例子:
import matplotlib.pyplot as plt
import seaborn as sns
import pandas as pd
df = pd.DataFrame({'compound': [-20, -10, 100, 200, 300, -20, -10, 100, -10, 100, 200, 300],
'Category': ['a', 'a', 'a', 'a', 'a', 'b', 'b', 'b', 'c', 'c', 'c', 'c']})
df['score'] = df['compound'].apply(lambda x: 'pos' if x >= 0 else 'neg')
fig, (ax1, ax2, ax3, ax4) = plt.subplots(ncols=4, figsize=(14, 4))
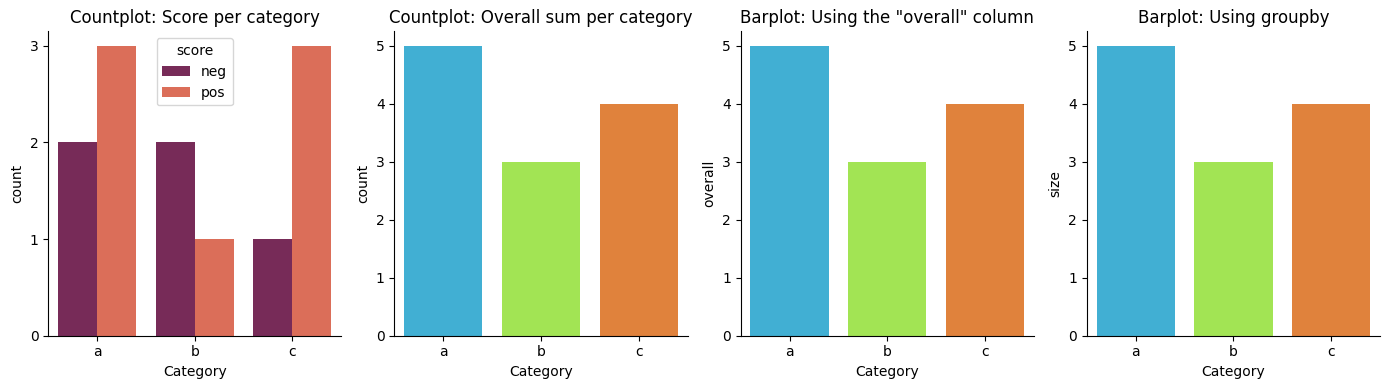
sns.countplot(data=df, x='Category', hue='score', palette='rocket', ax=ax1)
ax1.set_title('Countplot: Score per category')
ax1.locator_params(axis='y', integer=True)
sns.countplot(data=df, x='Category', palette='turbo', ax=ax2)
ax2.set_title('Countplot: Overall sum per category')
df['overall'] = df['Category'].apply(lambda cat: (df['Category'] == cat).sum())
sns.barplot(data=df, x='Category', y='overall', palette='turbo', ax=ax3)
ax3.set_title('Barplot: Using the "overall" column')
df_counts = df.groupby('Category', as_index=False).size()
sns.barplot(data=df_counts, x='Category', y='size', palette='turbo', ax=ax4)
ax4.set_title('Barplot: Using groupby')
sns.despine()
plt.tight_layout()
plt.show()


0 评论