本期是对热播网剧《雪中悍刀行》的一次爬虫与资料分析,总爬取条数1W条评论,很适合新人练手,案例中还特别加入了对评论的情绪文本分析处理,供大家参考,

爬虫方面:由于腾讯的评论资料是封装在json里面,所以只需要找到json档案,对需要的资料进行提取保存即可,
很多人学习蟒蛇,不知道从何学起,

很多人学习python,掌握了基本语法之后,不知道在哪里寻找案例上手,

很多已经可能案例的人,却不知道如何去学习更多高深的知识,

那么针对这三类人,我给大家提供一个好的学习平台,免费获取视频教程,电子书,以及课程的源代码!

QQ群:101677771

欢迎加入,一起讨论一起学习

视频网址:
评论json资料网址:
注:只要替换视频数字id的值,即可爬取其他视频的评论
本文内容仅作为编程技术学习讨论,相关代码和资料不可用于商业用途,否则后果自负,
如何查找视频id?


通过Chrome开发者工具的Network查找请求,具体使用可参考旧文:爬虫必备工具,掌握它就解决了一半的问题
项目结构:
一. 爬虫部分:
1. 爬取评论内容代码:
spiders.py
import requests
import re
import random

def get_html(url, params):
    uapools = [
        'Mozilla/5.0 (Macintosh; Intel Mac OS X 10_9_2) AppleWebKit/537.36 (KHTML, like Gecko) Chrome/35.0.1916.153 Safari/537.36',
        'Mozilla/5.0 (Windows NT 6.1; WOW64; rv:30.0) Gecko/20100101 Firefox/30.0',
        'Mozilla/5.0 (Macintosh; Intel Mac OS X 10_9_2) AppleWebKit/537.75.14 (KHTML, like Gecko) Version/7.0.3 Safari/537.75.14'
    ]

    thisua = random.choice(uapools)
    headers = {"User-Agent": thisua}
    r = requests.get(url, headers=headers, params=params)
    r.raise_for_status()
    r.encoding = r.apparent_encoding
    r.encoding = 'utf-8'# 不加此句出现乱码
    return r.text

def parse_page(infolist, data):
    commentpat = '"content":"(.*?)"'
    lastpat = '"last":"(.*?)"'
    commentall = re.compile(commentpat, re.S).findall(data)
    next_cid = re.compile(lastpat).findall(data)[0]
    infolist.append(commentall)
    return next_cid


def print_comment_list(infolist):
    j = 0
    for page in infolist:
        print('第' + str(j + 1) + '页\n')
        commentall = page
        for i in range(0, len(commentall)):
            print(commentall[i] + '\n')
        j += 1


def save_to_txt(infolist, path):
    fw = open(path, 'w+', encoding='utf-8')
    j = 0
    for page in infolist:
        #fw.write('第' + str(j + 1) + '页\n')
        commentall = page
        for i in range(0, len(commentall)):
            fw.write(commentall[i] + '\n')
        j += 1
    fw.close()


def main():
    infolist = []
    vid = '7579013546';
    cid = "0";
    page_num = 3000
    url = 'https://video.coral.qq.com/varticle/' + vid + '/comment/v2'
    #print(url)

    for i in range(page_num):
        params = {'orinum': '10', 'cursor': cid}
        html = get_html(url, params)
        cid = parse_page(infolist, html)


    print_comment_list(infolist)
    save_to_txt(infolist, 'content.txt')


main()
2. 爬取评论时间代码
sp.py
import requests
import re
import random


def get_html(url, params):
    uapools = [
        'Mozilla/5.0 (Macintosh; Intel Mac OS X 10_9_2) AppleWebKit/537.36 (KHTML, like Gecko) Chrome/35.0.1916.153 Safari/537.36',
        'Mozilla/5.0 (Windows NT 6.1; WOW64; rv:30.0) Gecko/20100101 Firefox/30.0',
        'Mozilla/5.0 (Macintosh; Intel Mac OS X 10_9_2) AppleWebKit/537.75.14 (KHTML, like Gecko) Version/7.0.3 Safari/537.75.14'
    ]

    thisua = random.choice(uapools)
    headers = {"User-Agent": thisua}
    r = requests.get(url, headers=headers, params=params)
    r.raise_for_status()
    r.encoding = r.apparent_encoding
    r.encoding = 'utf-8'# 不加此句出现乱码
    return r.text


def parse_page(infolist, data):
    commentpat = '"time":"(.*?)"'
    lastpat = '"last":"(.*?)"'

    commentall = re.compile(commentpat, re.S).findall(data)
    next_cid = re.compile(lastpat).findall(data)[0]

    infolist.append(commentall)

    return next_cid


def print_comment_list(infolist):
    j = 0
    for page in infolist:
        print('第' + str(j + 1) + '页\n')
        commentall = page
        for i in range(0, len(commentall)):
            print(commentall[i] + '\n')
        j += 1


def save_to_txt(infolist, path):
    fw = open(path, 'w+', encoding='utf-8')
    j = 0
    for page in infolist:
        #fw.write('第' + str(j + 1) + '页\n')
        commentall = page
        for i in range(0, len(commentall)):
            fw.write(commentall[i] + '\n')
        j += 1
    fw.close()


def main():
    infolist = []
    vid = '7579013546';
    cid = "0";
    page_num =3000
    url = 'https://video.coral.qq.com/varticle/' + vid + '/comment/v2'
    #print(url)

    for i in range(page_num):
        params = {'orinum': '10', 'cursor': cid}
        html = get_html(url, params)
        cid = parse_page(infolist, html)


    print_comment_list(infolist)
    save_to_txt(infolist, 'time.txt')


main()
二. 资料处理部分
1. 评论的时间戳转换为正常时间
time.py
# coding=gbk
import csv
import time

csvFile = open("data.csv",'w',newline='',encoding='utf-8')
writer = csv.writer(csvFile)
csvRow = []
#print(csvRow)
f = open("time.txt",'r',encoding='utf-8')
for line in f:
    csvRow = int(line)
    #print(csvRow)

    timeArray = time.localtime(csvRow)
    csvRow = time.strftime("%Y-%m-%d %H:%M:%S", timeArray)
    print(csvRow)
    csvRow = csvRow.split()
    writer.writerow(csvRow)

f.close()
csvFile.close()
2. 评论内容读入csv
CD.py
# coding=gbk
import csv
csvFile = open("content.csv",'w',newline='',encoding='utf-8')
writer = csv.writer(csvFile)
csvRow = []

f = open("content.txt",'r',encoding='utf-8')
for line in f:
    csvRow = line.split()
    writer.writerow(csvRow)

f.close()
csvFile.close()
3. 统计一天各个时间段内的评论数
py.py
# coding=gbk
import csv

from pyecharts import options as opts
from sympy.combinatorics import Subset
from wordcloud import WordCloud

with open('../Spiders/data.csv') as csvfile:
    reader = csv.reader(csvfile)

    data1 = [str(row[1])[0:2] for row in reader]

    print(data1)
print(type(data1))


#先变成集合得到seq中的所有元素,避免重复遍历
set_seq = set(data1)
rst = []
for item in set_seq:
    rst.append((item,data1.count(item)))  #添加元素及出现个数
rst.sort()
print(type(rst))
print(rst)

with open("time2.csv", "w+", newline='', encoding='utf-8') as f:
    writer = csv.writer(f, delimiter=',')
    for i in rst:                # 对于每一行的,将这一行的每个元素分别写在对应的列中
        writer.writerow(i)

with open('time2.csv') as csvfile:
     reader = csv.reader(csvfile)
     x = [str(row[0]) for row in reader]
     print(x)
with open('time2.csv') as csvfile:
    reader = csv.reader(csvfile)
    y1 = [float(row[1]) for row in reader]
    print(y1)
4. 统计最近评论数
py1.py
# coding=gbk
import csv

from pyecharts import options as opts
from sympy.combinatorics import Subset
from wordcloud import WordCloud

with open('../Spiders/data.csv') as csvfile:
    reader = csv.reader(csvfile)

    data1 = [str(row[0]) for row in reader]
    #print(data1)
print(type(data1))


#先变成集合得到seq中的所有元素,避免重复遍历
set_seq = set(data1)
rst = []
for item in set_seq:
    rst.append((item,data1.count(item)))  #添加元素及出现个数
rst.sort()
print(type(rst))
print(rst)


with open("time1.csv", "w+", newline='', encoding='utf-8') as f:
    writer = csv.writer(f, delimiter=',')
    for i in rst:                # 对于每一行的,将这一行的每个元素分别写在对应的列中
        writer.writerow(i)

with open('time1.csv') as csvfile:
     reader = csv.reader(csvfile)
     x = [str(row[0]) for row in reader]
     print(x)
with open('time1.csv') as csvfile:
    reader = csv.reader(csvfile)
    y1 = [float(row[1]) for row in reader]

    print(y1)
三. 资料分析
资料分析方面:涉及到了词云图,条形,折线,饼图,后三者是对评论时间与主演占比的分析,然而腾讯的评论时间是以时间戳的形式显示,所以要进行转换,再去统计出现次数,最后,新加了对评论内容的情感分析,
1. 制作词云图
wc.py
import numpy as np
import re
import jieba
from wordcloud import WordCloud
from matplotlib import pyplot as plt
from PIL import Image

# 上面的包自己安装,不会的就百度

f = open('content.txt', 'r', encoding='utf-8')  # 这是资料源,也就是想生成词云的资料
txt = f.read()  # 读取档案
f.close()  # 关闭档案,其实用with就好,但是懒得改了
# 如果是文章的话,需要用到jieba分词,分完之后也可以自己处理下再生成词云
newtxt = re.sub("[A-Za-z0-9\!\%\[\]\,\,]", "", txt)
print(newtxt)
words = jieba.lcut(newtxt)

img = Image.open(r'wc.jpg')  # 想要搞得形状
img_array = np.array(img)

# 相关配置,里面这个collocations配置可以避免重复
wordcloud = WordCloud(
    background_color="white",
    width=1080,
    height=960,
    font_path="../文悦新青年.otf",
    max_words=150,
    scale=10,#清晰度
    max_font_size=100,
    mask=img_array,
    collocations=False).generate(newtxt)

plt.imshow(wordcloud)
plt.axis('off')
plt.show()
wordcloud.to_file('wc.png')
轮廓图:wc.jpg

词云图:result.png (注:这里把英文字母过滤掉)

2. 制作最近评论数条形图
DrawBar.py
# encoding: utf-8
import csv
import pyecharts.options as opts
from pyecharts.charts import Bar
from pyecharts.globals import ThemeType


class DrawBar(object):

    """绘制柱形图类"""
    def __init__(self):
        """创建柱状图实体,并设定宽高和风格"""
        self.bar = Bar(init_opts=opts.InitOpts(width='1500px', height='700px', theme=ThemeType.LIGHT))

    def add_x(self):
        """为图形添加X轴资料"""
        with open('time1.csv') as csvfile:
            reader = csv.reader(csvfile)
            x = [str(row[0]) for row in reader]
            print(x)


        self.bar.add_xaxis(
            xaxis_data=https://www.cnblogs.com/sn520/archive/2022/01/04/x,

        )

    def add_y(self):
        with open('time1.csv') as csvfile:
            reader = csv.reader(csvfile)
            y1 = [float(row[1]) for row in reader]

            print(y1)


        """为图形添加Y轴资料,可添加多条"""
        self.bar.add_yaxis(  # 第一个Y轴资料
            series_name="评论数",  # Y轴资料名称
            y_axis=y1,  # Y轴资料
            label_opts=opts.LabelOpts(is_show=True,color="black"),  # 设定标签
            bar_max_width='100px',  # 设定柱子最大宽度
        )


    def set_global(self):
        """设定图形的全域属性"""
        #self.bar(width=2000,height=1000)
        self.bar.set_global_opts(
            title_opts=opts.TitleOpts(  # 设定标题
                title='雪中悍刀行近日评论统计',title_textstyle_opts=opts.TextStyleOpts(font_size=35)

            ),
            tooltip_opts=opts.TooltipOpts(  # 提示框配置项(鼠标移到图形上时显示的东西)
                is_show=True,  # 是否显示提示框
                trigger="axis",  # 触发型别(axis坐标轴触发,鼠标移到时会有一条垂直于X轴的实线跟随鼠标移动,并显示提示信息)
                axis_pointer_type="cross"# 指示器型别(cross将会生成两条分别垂直于X轴和Y轴的虚线,不启用trigger才会显示完全)
            ),
            toolbox_opts=opts.ToolboxOpts(),  # 工具箱配置项(什么都不填默认开启所有工具)

        )

    def draw(self):
        """绘制图形"""

        self.add_x()
        self.add_y()
        self.set_global()
        self.bar.render('../Html/DrawBar.html')  # 将图绘制到 test.html 档案内,可在浏览器打开
    def run(self):
        """执行函式"""
        self.draw()


if __name__ == '__main__':
    app = DrawBar()

app.run()
效果图:DrawBar.html

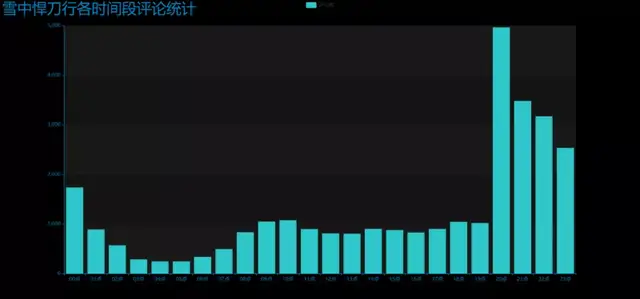
3. 制作每小时评论条形图
DrawBar2.py
# encoding: utf-8
# encoding: utf-8
import csv
import pyecharts.options as opts
from pyecharts.charts import Bar
from pyecharts.globals import ThemeType


class DrawBar(object):

    """绘制柱形图类"""
    def __init__(self):
        """创建柱状图实体,并设定宽高和风格"""
        self.bar = Bar(init_opts=opts.InitOpts(width='1500px', height='700px', theme=ThemeType.MACARONS))

    def add_x(self):
        """为图形添加X轴资料"""
        str_name1 = '点'

        with open('time2.csv') as csvfile:
            reader = csv.reader(csvfile)
            x = [str(row[0] + str_name1) for row in reader]
            print(x)


        self.bar.add_xaxis(
            xaxis_data=https://www.cnblogs.com/sn520/archive/2022/01/04/x
        )

    def add_y(self):
        with open('time2.csv') as csvfile:
            reader = csv.reader(csvfile)
            y1 = [int(row[1]) for row in reader]

            print(y1)


        """为图形添加Y轴资料,可添加多条"""
        self.bar.add_yaxis(  # 第一个Y轴资料
            series_name="评论数",  # Y轴资料名称
            y_axis=y1,  # Y轴资料
            label_opts=opts.LabelOpts(is_show=False),  # 设定标签
            bar_max_width='50px',  # 设定柱子最大宽度

        )


    def set_global(self):
        """设定图形的全域属性"""
        #self.bar(width=2000,height=1000)
        self.bar.set_global_opts(
            title_opts=opts.TitleOpts(  # 设定标题
                title='雪中悍刀行各时间段评论统计',title_textstyle_opts=opts.TextStyleOpts(font_size=35)

            ),
            tooltip_opts=opts.TooltipOpts(  # 提示框配置项(鼠标移到图形上时显示的东西)
                is_show=True,  # 是否显示提示框
                trigger="axis",  # 触发型别(axis坐标轴触发,鼠标移到时会有一条垂直于X轴的实线跟随鼠标移动,并显示提示信息)
                axis_pointer_type="cross"# 指示器型别(cross将会生成两条分别垂直于X轴和Y轴的虚线,不启用trigger才会显示完全)
            ),
            toolbox_opts=opts.ToolboxOpts(),  # 工具箱配置项(什么都不填默认开启所有工具)

        )

    def draw(self):
        """绘制图形"""

        self.add_x()
        self.add_y()
        self.set_global()
        self.bar.render('../Html/DrawBar2.html')  # 将图绘制到 test.html 档案内,可在浏览器打开
    def run(self):
        """执行函式"""
        self.draw()

if __name__ == '__main__':
    app = DrawBar()

app.run()
效果图:DrawBar2.html
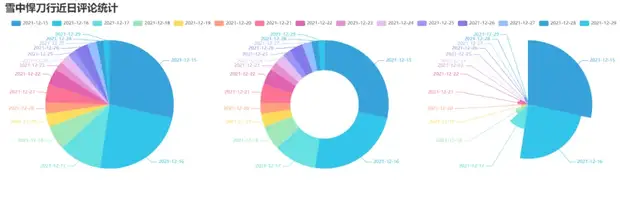
4. 制作近日评论数饼图
pie_pyecharts.py
import csv
from pyecharts import options as opts
from pyecharts.charts import Pie
from random import randint
from pyecharts.globals import ThemeType
with open('time1.csv') as csvfile:
    reader = csv.reader(csvfile)
    x = [str(row[0]) for row in reader]
    print(x)
with open('time1.csv') as csvfile:
    reader = csv.reader(csvfile)
    y1 = [float(row[1]) for row in reader]
    print(y1)
num = y1
lab = x
(
    Pie(init_opts=opts.InitOpts(width='1700px',height='450px',theme=ThemeType.LIGHT))#默认900,600
    .set_global_opts(
        title_opts=opts.TitleOpts(title="雪中悍刀行近日评论统计",
                                               title_textstyle_opts=opts.TextStyleOpts(font_size=27)),legend_opts=opts.LegendOpts(

            pos_top="10%", pos_left="1%",# 图例位置调整
            ),)
    .add(series_name='',center=[280, 270], data_pair=[(j, i) for i, j in zip(num, lab)])#饼图
   .add(series_name='',center=[845, 270],data_pair=[(j,i) for i,j in zip(num,lab)],radius=['40%','75%'])#环图
    .add(series_name='', center=[1380, 270],data_pair=[(j, i) for i, j in zip(num, lab)], rosetype='radius')#南丁格尔图
).render('pie_pyecharts.html')
效果图
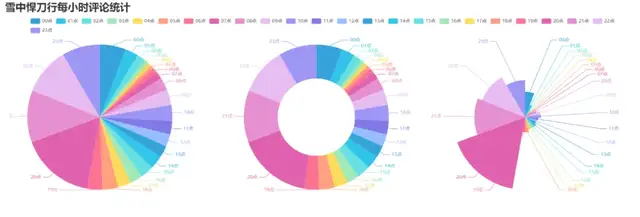
5. 制作每小时评论饼图
pie_pyecharts2.py
import csv
from pyecharts import options as opts
from pyecharts.charts import Pie
from random import randint
from pyecharts.globals import ThemeType

str_name1 = '点'
with open('time2.csv') as csvfile:
    reader = csv.reader(csvfile)
    x = [str(row[0]+str_name1) for row in reader]
    print(x)
with open('time2.csv') as csvfile:
    reader = csv.reader(csvfile)
    y1 = [int(row[1]) for row in reader]

    print(y1)
num = y1
lab = x
(
    Pie(init_opts=opts.InitOpts(width='1650px',height='500px',theme=ThemeType.LIGHT,))#默认900,600
     .set_global_opts(
        title_opts=opts.TitleOpts(title="雪中悍刀行每小时评论统计"
                                  ,title_textstyle_opts=opts.TextStyleOpts(font_size=27)),
        legend_opts=opts.LegendOpts(

            pos_top="8%", pos_left="4%",# 图例位置调整
            ),
    )
    .add(series_name='',center=[250, 300], data_pair=[(j, i) for i, j in zip(num, lab)])#饼图
    .add(series_name='',center=[810, 300],data_pair=[(j,i) for i,j in zip(num,lab)],radius=['40%','75%'])#环图
    .add(series_name='', center=[1350, 300],data_pair=[(j, i) for i, j in zip(num, lab)], rosetype='radius')#南丁格尔图
).render('pie_pyecharts2.html')
效果图
6. 制作观看时间区间评论统计饼图
pie_pyecharts3.py
# coding=gbk
import csv
from pyecharts import options as opts
from pyecharts.globals import ThemeType
from sympy.combinatorics import Subset
from wordcloud import WordCloud
from pyecharts.charts import Pie
from random import randint
with open(/data.csv') as csvfile:
    reader = csv.reader(csvfile)
    data2 = [int(row[1].strip('')[0:2]) for row in reader]
    #print(data2)
print(type(data2))
#先变成集合得到seq中的所有元素,避免重复遍历
set_seq = set(data2)
list = []
for item in set_seq:
    list.append((item,data2.count(item)))  #添加元素及出现个数
list.sort()
print(type(list))
#print(list)
with open("time2.csv", "w+", newline='', encoding='utf-8') as f:
    writer = csv.writer(f, delimiter=',')
    for i in list:                # 对于每一行的,将这一行的每个元素分别写在对应的列中
        writer.writerow(i)
n = 4#分成n组
m = int(len(list)/n)
list2 = []
for i in range(0, len(list), m):
    list2.append(list[i:i+m])

print("凌晨 : ",list2[0])
print("上午 : ",list2[1])
print("下午 : ",list2[2])
print("晚上 : ",list2[3])

with open('time2.csv') as csvfile:
    reader = csv.reader(csvfile)
    y1 = [int(row[1]) for row in reader]

    print(y1)

n =6
groups = [y1[i:i + n] for i in range(0, len(y1), n)]

print(groups)

x=['凌晨','上午','下午','晚上']
y1=[]
for y1 in groups:
    num_sum = 0
    for groups in y1:
        num_sum += groups
str_name1 = '点'
num = y1
lab = x
(
    Pie(init_opts=opts.InitOpts(width='1500px',height='450px',theme=ThemeType.LIGHT))#默认900,600
        .set_global_opts(
        title_opts=opts.TitleOpts(title="雪中悍刀行观看时间区间评论统计"
                                  , title_textstyle_opts=opts.TextStyleOpts(font_size=30)),
        legend_opts=opts.LegendOpts(

            pos_top="8%",  # 图例位置调整
        ),
    )
    .add(series_name='',cent


0 评论