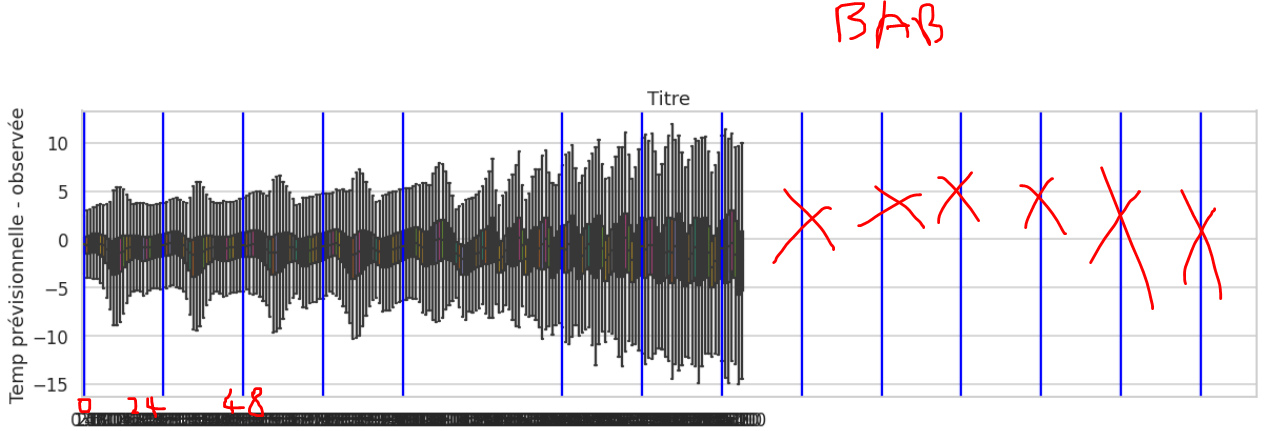
我想每 24 个 X 间隔在箱线图 seaborn 上添加垂直线。
我的功能:
def BoxPlot(data,x_attrib, y_attrib, showfliers=False, orient='h', *args):

    sns.set(style="whitegrid", palette="Set3", context='talk', color_codes=False) #défaut

    fig, ax = plt.subplots(1,1,figsize=(20,5))
    ax = sns.boxplot(x=x_attrib, y=y_attrib, data=data, showfliers = showfliers, orient=orient, palette='Dark2', ax=ax) #palette="Set2")

    list_diff_hours = np.sort(data[x_attrib].astype(int).unique())
    print(list_diff_hours)
    for i in list_diff_hours:
      if (i % 24 == 0):
        print(f"""Add line x={i}""")
        ax.axvline(x = i, color = 'b', label = '12')

    ax.set(title=args[0])
    ax.set(xlabel=args[1]) # idem ax.set(xlabel=None)
    ax.set(ylabel=args[2])

    #ax.set(xticklabels=[])  # remove labels from x axis
    ax.tick_params(bottom=False)  # remove the ticks

    # Show the plot
    plt.show()
我用以下方法绘制了 n 条垂直线:
我的问题是 data['x_attrib'] 不连续:
    DIFF_HOURS  DIFF_TEMP
0   0.0     0.050886
1   1.0     0.660698
2   2.0     1.656014
3   3.0     2.543857
4   4.0     3.071813
...     ...     ...
627770  336.0   -7.524095
627771  339.0   -4.180723
627772  342.0   -8.724546
627773  345.0   -10.176562
627774  348.0   -8.047641

627775 rows × 2 columns
函式执行:
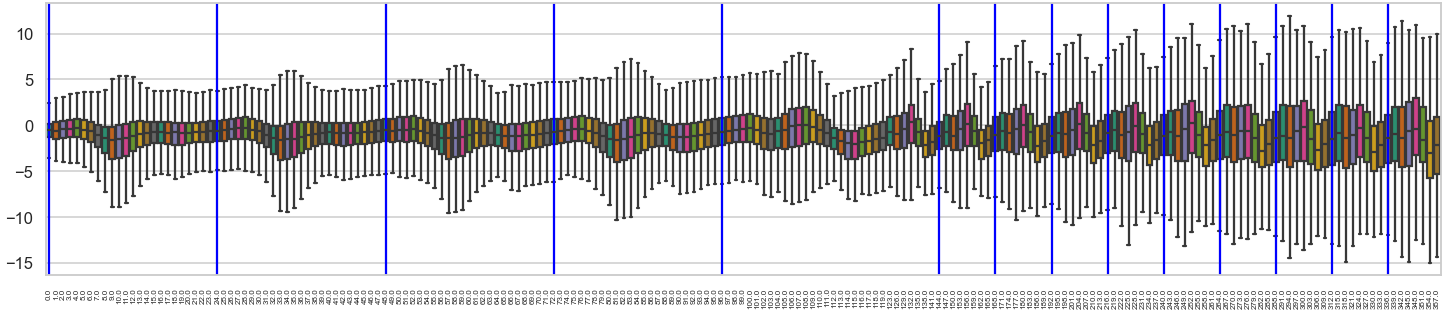
[ 0 1 2 3 4 5 6 7 8 9 10 11 12 13 14 15 16 17
18 19 20 21 22 23 24 25 26 27 28 29 30 31 32 33 34 35
36 37 38 39 40 41 42 43 44 45 46 47 48 49 50 51 52 53
54 55 56 57 58 59 60 61 62 63 64 65 66 67 68 69 70 71
72 73 74 75 76 77 78 79 80 81 82 83 84 85 86 87 88 89
90 91 92 93 94 95 96 97 98 99 100 101 102 103 104 105 106 107
108 109 110 111 112 113 114 115 116 117 118 119 123 126 129 132 135 138
141 144 147 150 153 156 159 162 165 168 171 174 177 180 183 186 189 192
195 198 201 204 207 210 213 216 219 222 225 228 231 234 237 240 243 246
249 252 255 258 261 264 267 270 273 276 279 282 285 288 291 294 297 300
303 306 309 312 315 318 321 324 327 330 333 336 339 342 345 348 351 354
357]
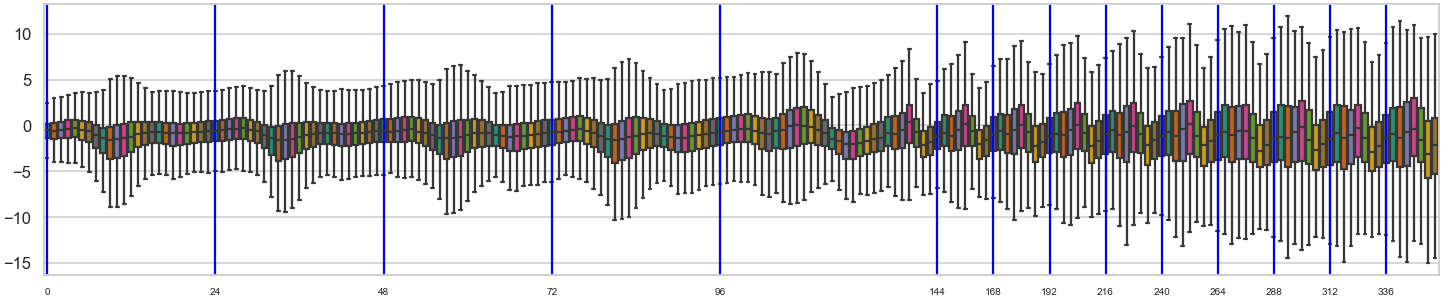
Add line x=0
Add line x=24
Add line x=48
Add line x=72
Add line x=96
Add line x=144
Add line x=168
Add line x=192
Add line x=216
Add line x=240
Add line x=264
Add line x=288
Add line x=312
Add line x=336
我不应该在最后一个 X boxplot 值之后有线条。我不明白。
呼叫函式:
path = '/xxx'
data2boxplot = pd.read_csv(os.path.join(path, 'merged2_limited.csv'), sep=';')

BoxPlot(data2boxplot,
        'DIFF_HOURS',
        'DIFF_TEMP',
        False,
        'v',
        '',
        '',
        '')
另外如何在每行的 x 轴上放置标签?
样本资料
- 与所有 xticklabels 交替使用


0 评论