下面的脚本是关于不同主题的 stackoverflow 答案的混合,但与寻找信号峰值密切相关。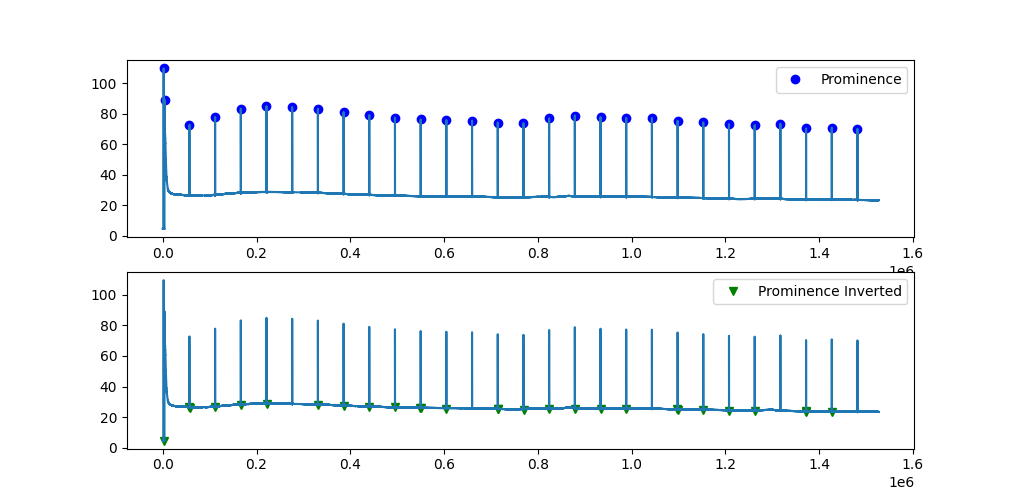
这是我的python脚本:
import pandas as pd
import numpy as np
from datetime import datetime
import matplotlib.pyplot as plt
from scipy.signal import find_peaks

# A parser is required to translate the timestamp
custom_date_parser = lambda x: datetime.strptime(x, "%d-%m-%Y %H:%M_%S.%f")

df = pd.read_csv('15-01-2022_05_00.csv', parse_dates=[ 'Timestamp'], date_parser=custom_date_parser)

x = df['Timestamp']
y = df['Mean_values']

# As per accepted answer here:
#https://stackoverflow.com/questions/1713335/peak-finding-algorithm-for-python-scipy
peaks, _ = find_peaks(y, prominence=1)

# Invert the data to find the lowest points of peaks as per answer here:
#https://stackoverflow.com/questions/61365881/is-there-an-opposite-version-of-scipy-find-peaks
valleys, _ = find_peaks(-y, prominence=1)

print(y[peaks])
print(y[valleys])
plt.subplot(2, 1, 1)
plt.plot(peaks, y[peaks], "ob"); plt.plot(y); plt.legend(['Prominence'])
plt.subplot(2, 1, 2)
plt.plot(valleys, y[valleys], "vg"); plt.plot(y); plt.legend(['Prominence Inverted'])
plt.show()
正如您在图片中看到的,并非所有“突出倒置”点都低于相应的峰值。prominence 反转函式来自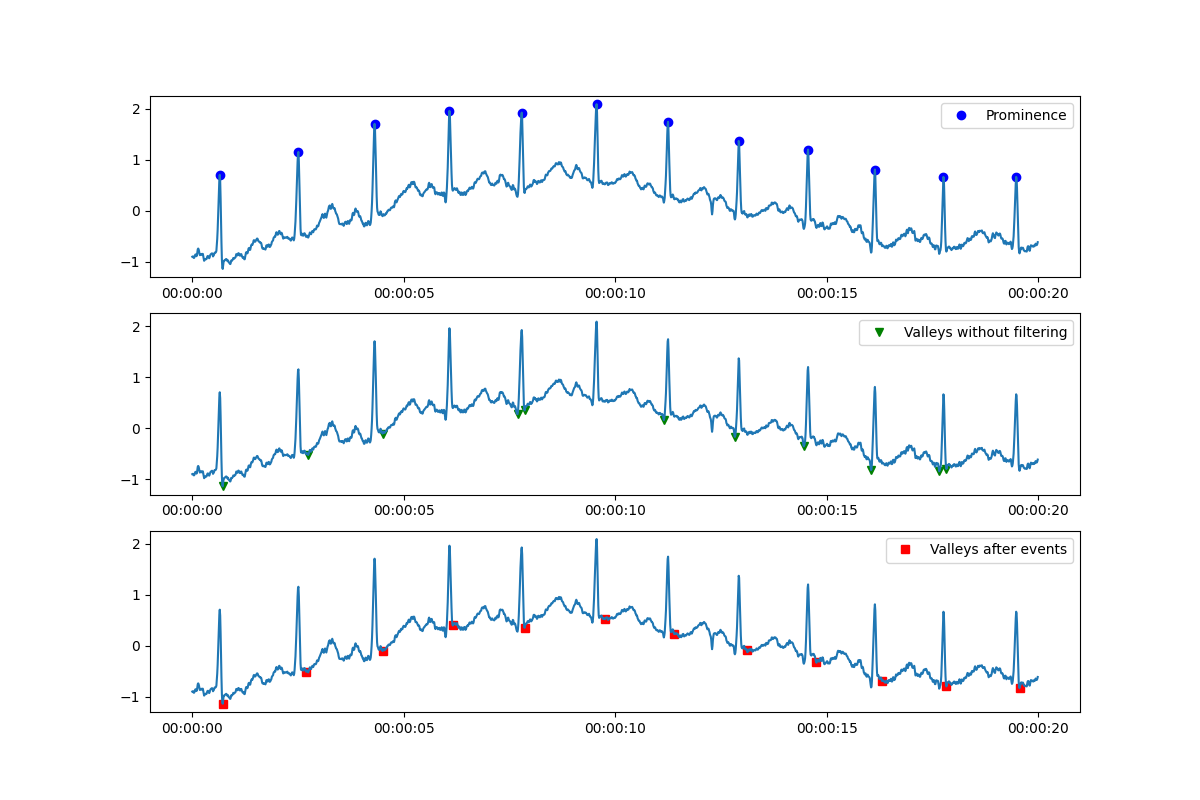
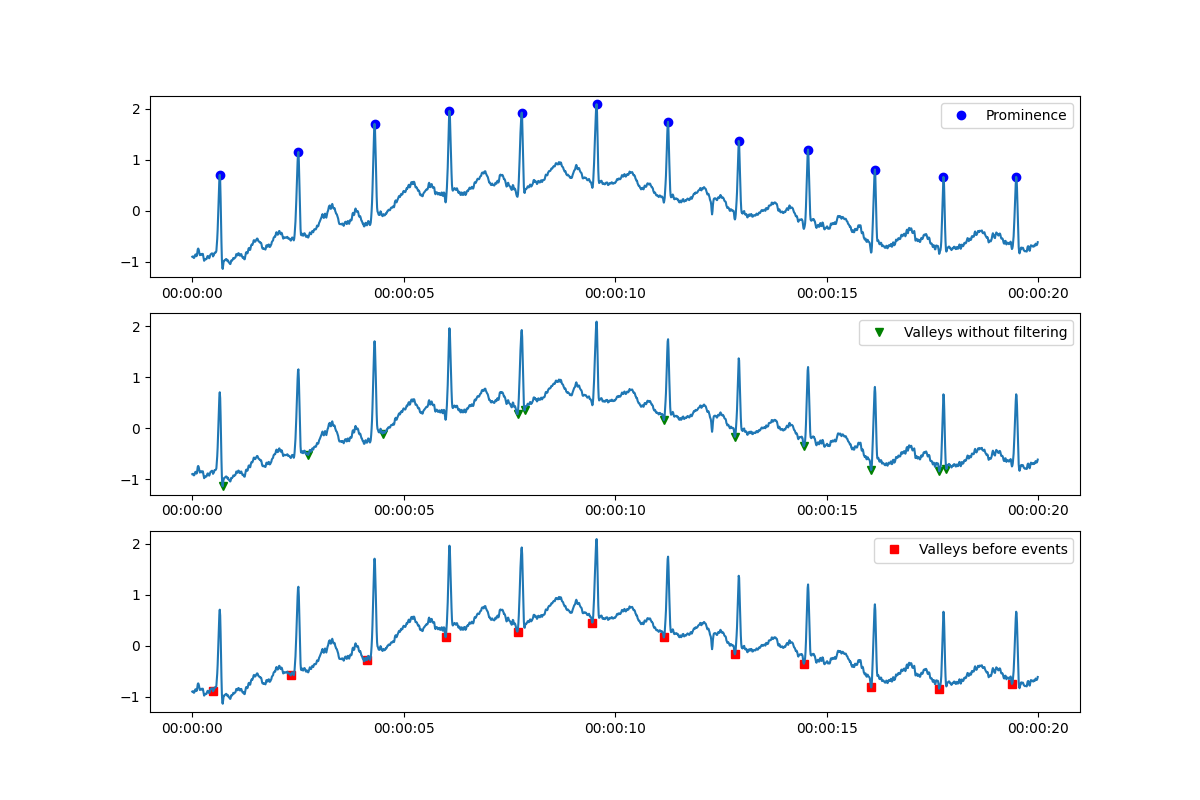
我不确定您打算如何处理这些最小值,但如果您只对基线偏移感兴趣,您可以直接计算峰值基线值,例如
baseline_per_peak = peaks.copy().astype(float)
for i, (start, stop) in enumerate(zip(peaks, peak_end)):
    baseline_per_peak[i] = y[start:stop].mean()

print(baseline_per_peak)
样本输出:
[-0.71125 -0.203    0.29225  0.72825  0.6835   0.79125  0.51225  0.23
  0.0345  -0.3945  -0.48125 -0.4675 ]
当然,这也可以很容易地适应高峰期之前的时期:
#valley in the short time period before a peak
#set time window, e.g., for 200 ms
time_window_size = pd.Timedelta(200, unit="ms")
time_of_peaks = x[peaks]
peak_start = x.searchsorted(time_of_peaks - time_window_size)
#in case of evenly spaced data points, this can be simplified
#and you just add n data points to your peak index array
#peak_start = peaks - n
true_valleys = peaks.copy()
for i, (start, stop) in enumerate(zip(peak_start, peaks)):
    true_valleys[i] = start   y[start:stop].argmin()


0 评论